24
25
MYTILINEOS HOLDINGS - SUSTAINABILITY REPORT
2016
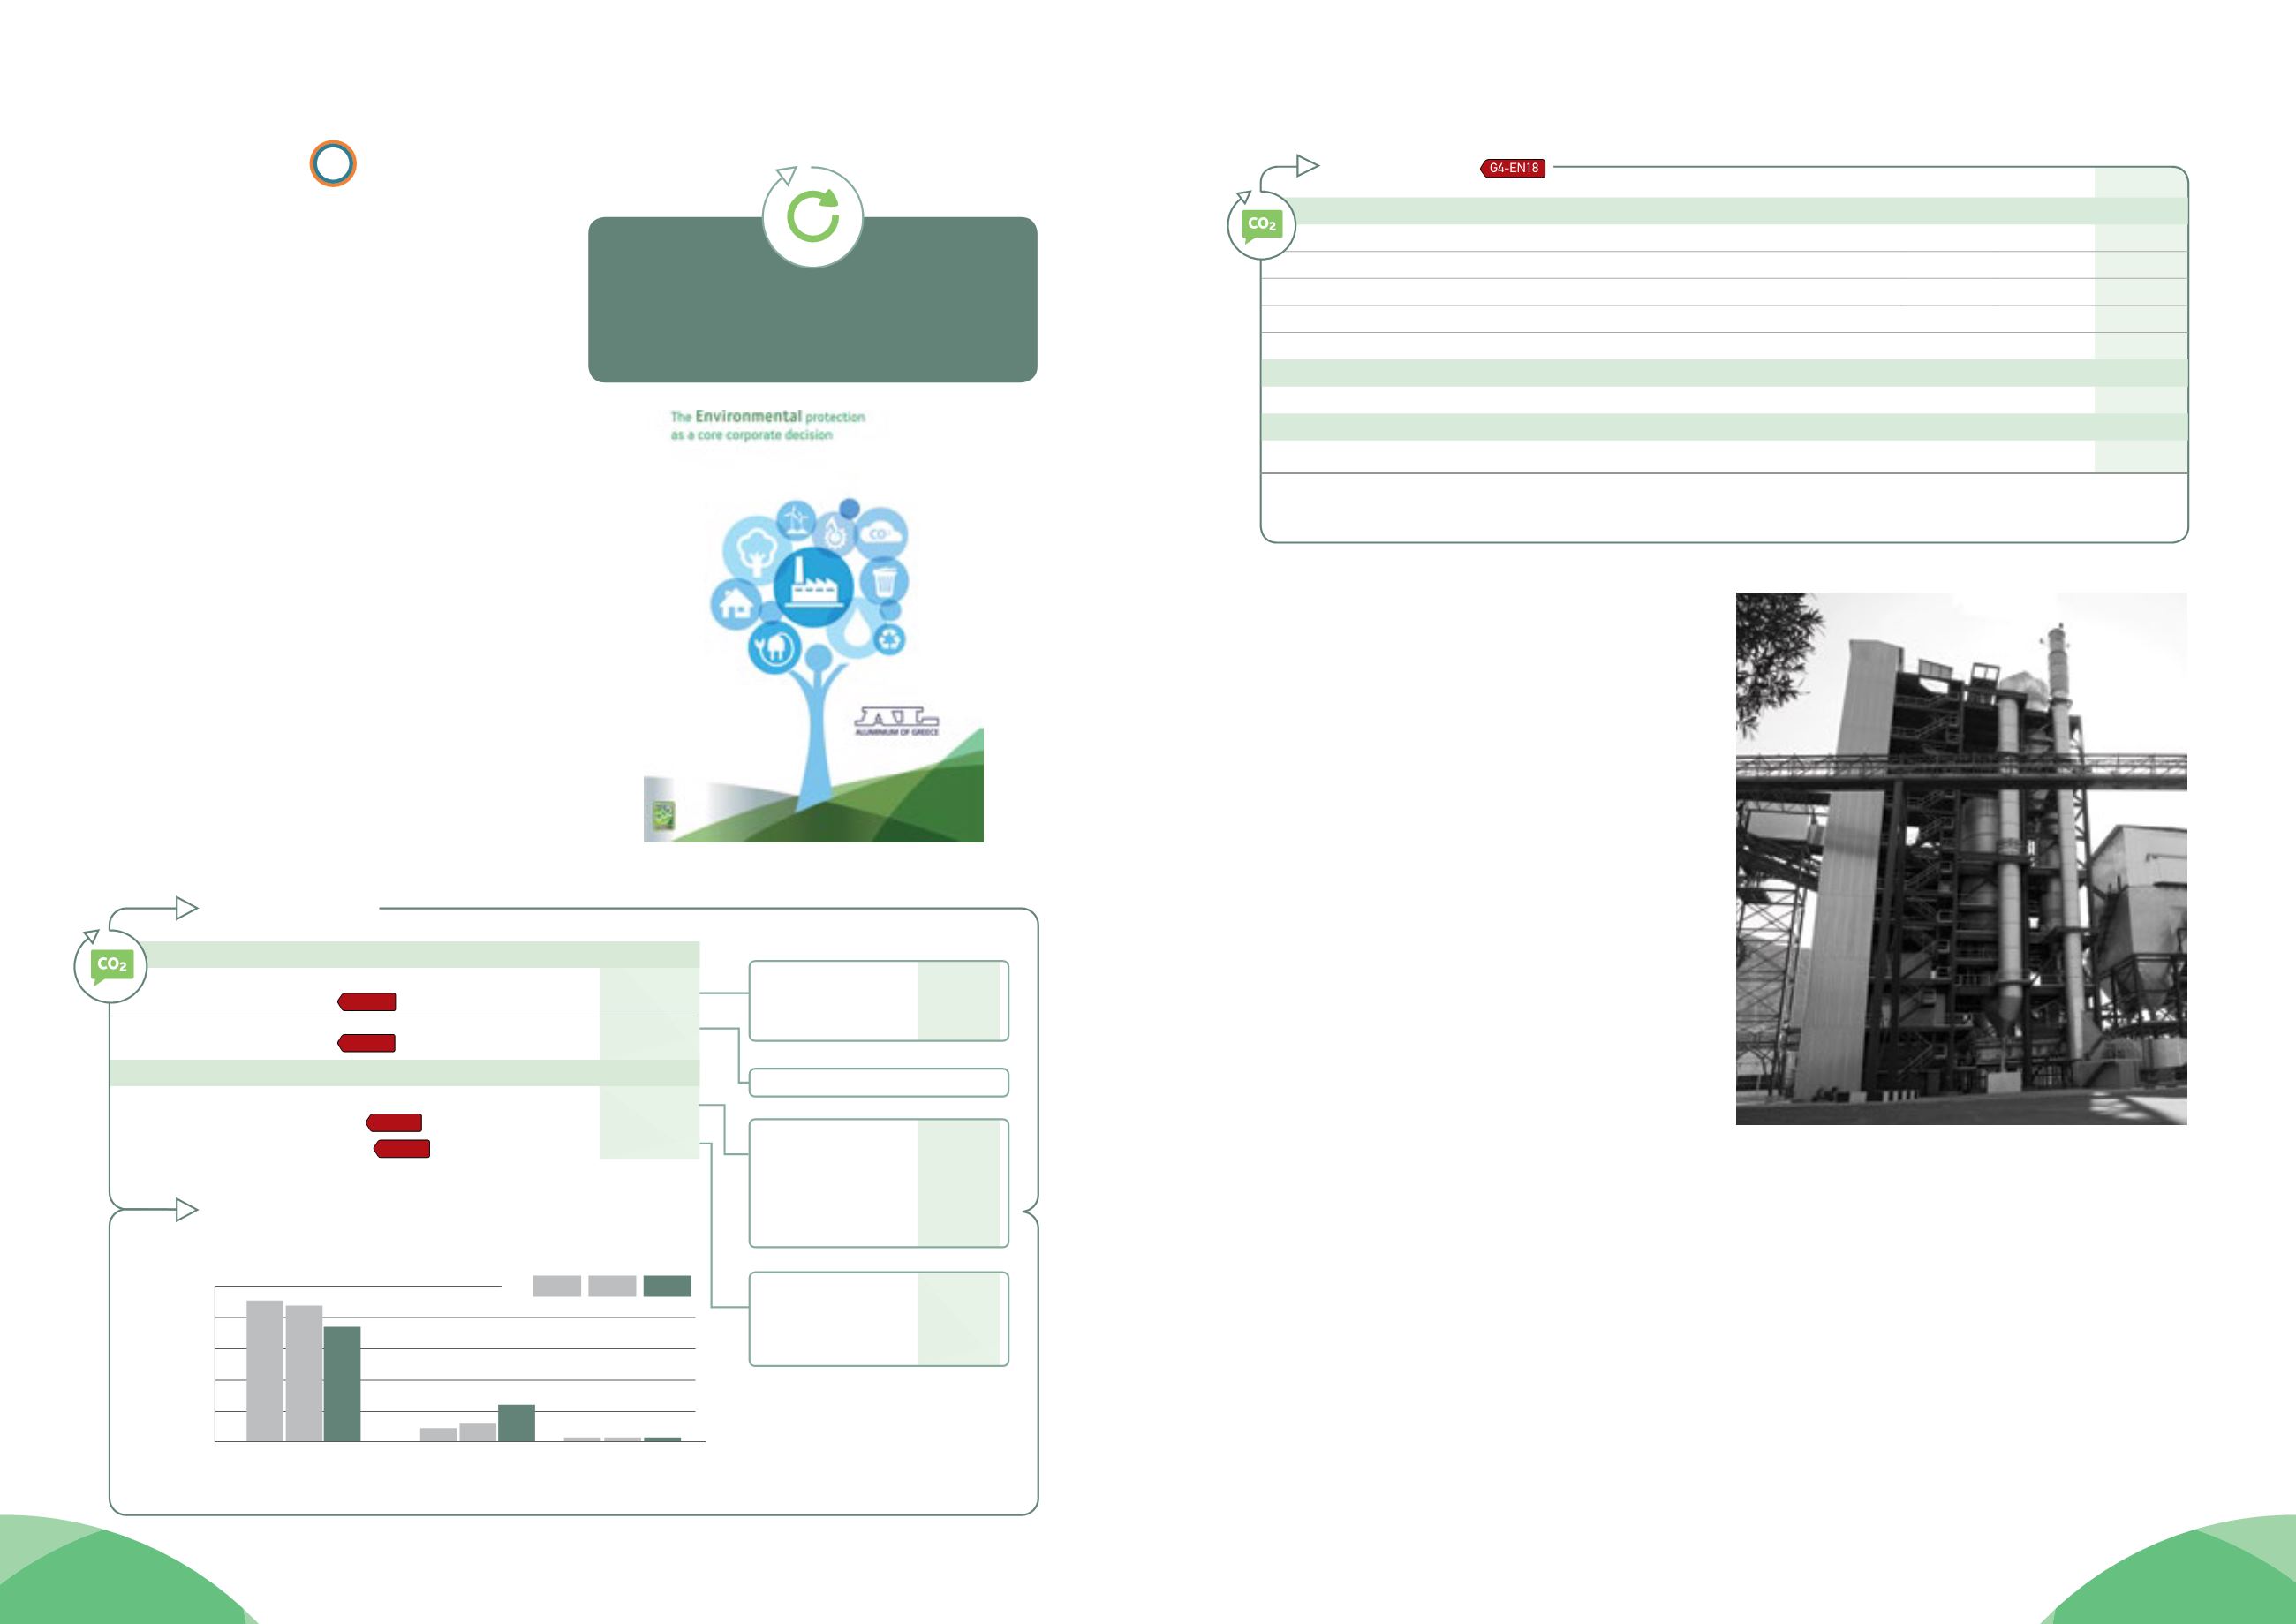
Group policy on adapting to climate change:
-
adapting-to-climatechange
7.1 Climate Change
MYTILINEOS Group constantly aims to carry out its business activity
in line with the principles of sustainable growth and, therefore,
aims to minimise its contribution to climate change. The Group
has adopted certain practices to deal with climate change, the most
importantonesbeingthecontinuousinvestmentinfacilitiesfeaturing
the latest technology, leading to reduced energy consumption and
gaseous emissions, the expansion of the use of Natural Gas to
nearly all its premises, thus improving the air quality of the greater
natural environment, and the Group’s commitment to research and
innovation for the utilisation of bauxite residues as rawmaterials.
7.1.1 Emissions
The MYTILINEOS Group activity sectors, and especially the
Metallurgy &Mining Sector and the Energy Sector, generate carbon
dioxide (CO
2
) emissions. These are distinguished into direct (Scope
1) and indirect (Scope 2) CO
2
emissions. Direct emissions result
primarily from the aluminiumproduction process (consumption of
fuels and chemical processing as part of the production process)
and secondarily from electricity production (consumption of
natural gas), with indirect emissions corresponding primarily to
the consumption of electricity. In 2016, total direct and indirect air
pollutant emissions stood at 4.67 million tonnes, which was 15.1%
higher than the 2015 figure. This was mainly due to the Energy
sector, where the production of electricity by the Group’s thermal
plants was increased.
Like most high energy-intensive industries, MYTILINEOS Group
produces air emissions that contribute to climate change. The
Group’s actions to stabilise CO
2
emissions are of substantial
importance because they support its operational efficiency. In
this context, the Group monitors CO
2
emissions, on a monthly
basis and implements timely corrective actions in order to
ensure that its annual carbon dioxide emissions are in line
with the legal restrictions and, most importantly, are kept at the
lowest possible level.
Also, MYTILINEOS Group comes under and complies fully with
the applicable regulatory framework and the allowances of the
European Union’s Emission Trading System (EU ETS), as well as
with the restrictions of the EU regulatory framework in force on
large combustion plants.
In the Metallurgy & Mining sector, we have set specific targets that
help stabilise CO
2
emissions during aluminium production. More
specifically, primary-cast aluminium is obtained from alumina
through electrolysis. This process produces carbon dioxide,
fluorine emissions and perfluorocarbons (PFCs). ALUMUNIUM of
GREECE controls these particular emissions through its constant
efforts and appropriate technical interventions. Also, the extension
of the use of natural gas to virtually all company installations haw
minimised the use of fuel, thus improving air quality in the wider
area of the plant.
Additionally, continuing its business investments that benefit
the environment, MYTILINEOS Group launched a new, modern
alumina calcination plant (November 2016), with a nominal
production capacity of 1,350 t per day. This asset replaces the
previous, technologically outdated, high thermal consumption
unit. In addition to the great advantages it offers in terms
of flexibility in production, this project is also expected to
significantly reduce energy consumption and carbon dioxide
emissions. Specifically, it is expected to bring about a
25%
decrease in energy consumption and a reduction of emissions
by approximately 20,000 tonnes of CO
2
and 15 tonnes of NOx per
year. A decrease is also expected in the emission of particles by
80-85%, which corresponds to 30-35 tons per year.
*
The volume of Scope 3 emissions refers only
to the EPC Projects sector, with the exception of
business travel, which also includes the
performance of the Energy sector.
2015
2016
4,058,973.6
3,793,740.7
TOTAL
4,674,616.8
1,666,371.3
2.,392,602.3
2014
1,489,015.2
2,304,725.5
Other indirect CO
2
emissions
(Scope 3)*
Other significant emissions
1,619.47
4,998.1
2,868.6
4,238.2
1,185.4
4,866.9
2015
2014
2016
100%
80%
88.3%
91.8%
75.8%
60%
40%
20%
0%
11.5%
8.0%
24.0%
Energy
Sector
Metallurgy &
Mining Sector
0.2%
0.2%
0.2%
EPC Project
Sector
Percentage of emissions
(Scope 1 & Scope 2)
by activity sector
Emissions
(t CO
2
eq)
Direct CO
2
emissions
(Scope1)
Fuels
(CO
2
)
Processes
(CO
2
)
Processes
(PFCs)
Transport
(CO
2
)
1,941,956.9
291,281.2
88,310.5
7,560.0
392.5
558.1
234.8
3,276.9
1,226.3
275.0
88.7
Electricity consumption
SOx
NΟx
Fluorine
Particles
Transportation
of products
(CO
2
)
Business travel
(CO
2
)
Personnel travel
to/from work
(CO
2
)
G4-EN15
G4-EN16
G4-EN17
G4-EN21
2,353,575.6
2,321,041.2
Indirect CO
2
emissions
(Scope2)
* Perfluorocarbons (CF
4
&C
2
F
6
), are gases that contribute significantly to global warming. To illustrate this, suffice to mention that 1 tonne of CF
4
is equivalent to 7,390
tonnes of CO
2
, while 1 tonne of C
2
F
6
is equivalent to 12,200 tonnes of CO
2
. These perfluorocarbons can be reduced by controlling the frequency and duration of the anode
effect during the electrolysis process.
Specific emissions
G4-EN18
In the Energy activity sector, the key objective is to maintain the
efficiency rates achieved in the operation of the thermal power
plants of Protergia, which are among the highest in Greece,
making the best possible use of natural gas as their primary fuel.
To produce electricity, the Group’s thermal plants use natural
gas. This is a fossil fuel that has a lower carbon content compared
to other mineral fuels, does not release SO
2
and particles,
emits less NOx (mainly NO
2
) in exhaust gases compared to the
maximum allowed quantities under the applicable laws, and
produces less CO
2
(by 70%) compared to lignite-fired plants.
2015
2016
Change
METALLURGY & MINING SECTOR
Specific emissions in Bauxite production (t CO
2
/t of bauxite produced)
0.012
0.018
50.0%
Specific emissions in Alumina production (t CO
2
/t of hydrated alumina produced)
0.76
0.53
-30.2%
Specific emissions in Aluminium production (t CO
2
/t of aluminium produced)
14.6
15.3
5.15%
Fluorine emissions (t/y)
243.2
275.0
13.8%
PFC emissions (t CO
2
/y)*
65,909.6
88,310.5
33.9%
ENERGY SECTOR
Specific CO
2
emissions (t CO
2
/TJ of electricity produced)
93.8
95.2
1.2%
EPC PROJECT SECTOR
Specific CO
2
emissions
(t CO
2
/t of processed metal)
4.9
4.4
-10.7%
5
4
7
8
15
20
23
24
27
29
30
28
21
11
22
12
13
3
16
6
14
19


